You can create/edit the default dashboard for all users in your organization if you have been given explicit access to do so.
Managed roles having this permission: System admin and PIM admin.
The Dashboard improves productivity by offering quick access to important information, helping your users to work efficiently and make better decisions.
The Dashboard consists of customizable widgets sourced from products, assets and tasks information in PIM. Create a default dashboard presenting information in a way that suits your organization.

Please note: The default dashboard will be loaded for all new users and users who have not edited their dashboard.
Do the following to create a default dashboard for your organization:
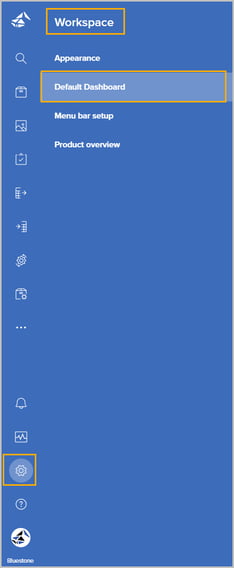
- Select Settings | Workspace from the main navigation bar, and then click Default Dashboard from the sub-menu:
- Click Edit in the upper right corner to start setting up the dashboard.
- Add widgets by clicking the plus icon (Add widget). The following page is presented:
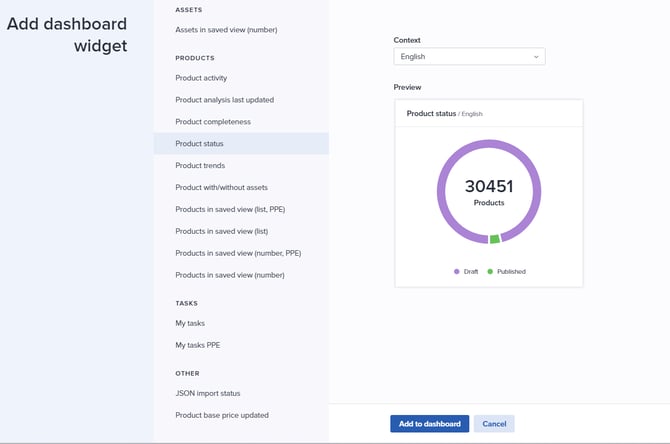
- Select the relevant type of widget from the categorized list on the left-hand side.
See Dashboard widgets for details about each widget type. - If the selected widget needs to be connected to a Saved view, click the dropdown to select the relevant view.
Tip! Please see Product views and Asset views for information on how to create such views.
- If the selected widget needs to be connected to a Context, click the dropdown to select the relevant context.
- The "number" widgets (e.g. 'Products in saved view (number)') are presented with a colored header. Select relevant color from the Information dropdown.
- Verify your setup in the Preview.
- Click Add to dashboard.
- Repeat steps 4 - 10 until all desired widgets are added.
- Optionally re-arrange the placement of the widgets by using drag-n-drop:

- If you need to change the configuration of a widget, hover it and click the cogwheel icon.
- If you want to remove a widget, hover it and click the trashbin icon.
- Click Save when you are happy with the setup.
Tip! Pie chart slices can be hovered to view the %. When clicked, the resulting items are presented in the grid.