Metrics
Collect product metrics for presenting trends
The Metrics plugin needs to be activated for your organization. You need to be given explicit permission to set up/edit metrics.
Managed roles having this permission: Metrics admin and Plugin admin.
Actions
Edit Export Activate/deactivate Delete
Add a metric widget to the dashboard
Use a metric widget in the Dashboard
Overview
The Metrics plugin allows you to keep track of product trends over time. Set up queries to collect relevant product metrics daily. Over time, this data will present trends, which can be used to evaluate progress toward your key business goals.
Users can view these trends as graphs in their Dashboard.
You can find Metrics as a separate module in the main navigation bar:

Tip! Find out how to customize the menu bar.
You can view all metrics created within the organization from the grid. For each metric, the Status, Name, Run time, Updated time, Created time and Created by are presented.
Actions
Hover a metric and click the 3-dots menu on the right-hand side to access the following actions:

Please see the following sections for details.
Edit
Allows you to update the metric's main information and/or query. Please see Create a new metric for details.
Export
Allows you to export already collected metrics. Do the following:
- Click Export from the menu.
The following window is presented:
- Select XLSX or CSV as File format.
- Select from which Time period to fetch data. Select Custom to specify from/to dates.
- Click Export to start the operation. The progress/status of the export job can be viewed from the System monitor:

- When the export job is finished, you can download the file from the Files tab in the export job's Details panel:


Activate/deactivate
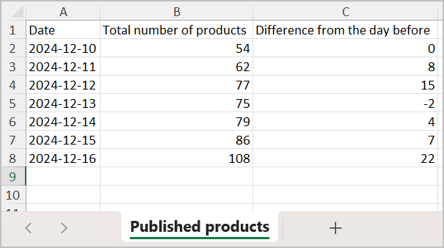
Allows you to activate an inactive metric, or vice versa. As long as a metric is active, the number of products matching the query and the diff value from the day before is stored daily.
When deactivating a metric, statistics will no longer be collected but historical data will be kept:

If activating a metric where historical data exists, a warning is presented. In this case, you should evaluate whether keeping the historical data will be correct or not:

Delete
Allows you to remove a metric and already collected data. Confirm the deletion by clicking Delete in the pop-up:

Create a new metric
Follow these steps to create a new metric:
- Click the plus icon (Create metric) in the upper right corner.

The Create new metric page is opened:
- Specify a Name for the metric. This name will be presented for users when adding metric widgets to their dashboard. Please see Add a metric widget to the Dashboard for details.
- As metrics will be gathered once a day, the Run time is set to Scheduled daily. Specify the time of day to collect this data.
- Set Status of the metric to Active if it should be activated immediately after saving it. You can leave it Inactive and activate it directly from the grid at a later stage, please see Activate/deactivate.
- Click Edit query in the Products section to define conditions for products to be counted:

Tip! Please see Filtering using the query builder for details about how to build a query.
- Click Apply to save the query.
Note: Once the query is saved, the number of products matching the query is presented in the Products section.
- Click Save when you are done.
The new metric is now presented in the grid.
Add a metric widget to the Dashboard
For each active metric, a 'Product trends' widget can be added to the Dashboard. These widgets will show the development over time as a graph.
Do the following to add a metric widget to a Dashboard:
- Go into edit mode of the relevant Dashboard. Please see Set up the default dashboard or Set up/edit your dashboard for details.
- Click the plus icon (Add widget) in the upper right corner.
- Select Product trends in the left panel. The following page is presented:

- Select the relevant Metric from the drop-down list.
- Click Add to dashboard.
The widget is now added and can be moved to the desired location on the Dashboard. - Click Save when you are done.
Please see the following section on how to utilize the widget.
Use a metric widget in the Dashboard
Metrics are collected every day based on the number of products matching a query (e.g. "products with status Published").
Collected metrics can be presented as 'Product trends' in the Dashboard. Please see Add a metric widget to the Dashboard for details.
Once a 'Product trends' widget is added to your Dashboard, it will present collected data as a graph:

The following options apply:
- Select whether to view Total or Difference values.
- Total will, for each day, present the number of products matching the query.
- Difference will, for each day, present the difference (+ or -) in the number of products matching the query from the day before.
- Select the period to view metrics from. Either click one of the predefined number of days, or click Custom to define a specific time range.
- You can hover the graph to see the value for a specific date.
![Bluestone_PIM_white_logo_RBB-3.png]](https://help.bluestonepim.com/hs-fs/hubfs/Bluestone_PIM_white_logo_RBB-3.png?height=50&name=Bluestone_PIM_white_logo_RBB-3.png)